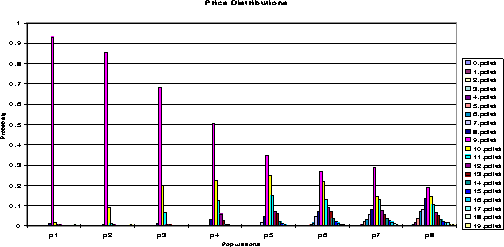
Figure 2: Price distributions for populations of 0-level buyers and
sellers. The prices are ![]() . The columns represent the
percentage of time the good was sold at each price, in each
population. In p1 sellers return qualities
. The columns represent the
percentage of time the good was sold at each price, in each
population. In p1 sellers return qualities
![]() , in p2 its
, in p2 its ![]() , and so
on such that by p8 its
, and so
on such that by p8 its ![]() . The highest peak
in all populations corresponds to price 9.
. The highest peak
in all populations corresponds to price 9.
Since there is no obvious way to analytically determine how different
populations of agents would interact and, of greater interest to us,
how much better (or worse) the agents with deeper models would fare,
we decided to implement a society of the agents described above and
ran it to test our hypotheses. In all tests, we had 5 buyers and 8
sellers. The buyers had the same value function ![]() , which means that if p = q then the buyers will prefer the
seller that offers the higher quality. All sellers had costs equal to
the quality they returned in order to support the common wisdom
assumption that quality goods cost more to produce. We also set
, which means that if p = q then the buyers will prefer the
seller that offers the higher quality. All sellers had costs equal to
the quality they returned in order to support the common wisdom
assumption that quality goods cost more to produce. We also set
![]() ,
, ![]() , and
, and ![]() .
There were 100 runs done for each population of agents, each run
consisting of 10000 auctions (i.e. iterations of the protocol). The
lessons presented here are based on the averages of these 100 runs.
.
There were 100 runs done for each population of agents, each run
consisting of 10000 auctions (i.e. iterations of the protocol). The
lessons presented here are based on the averages of these 100 runs.